
TerrusM odometric repeatability in subterranean areas
Reading time: 4 Minutes
09/12/22 Written By Shaun Coghlan
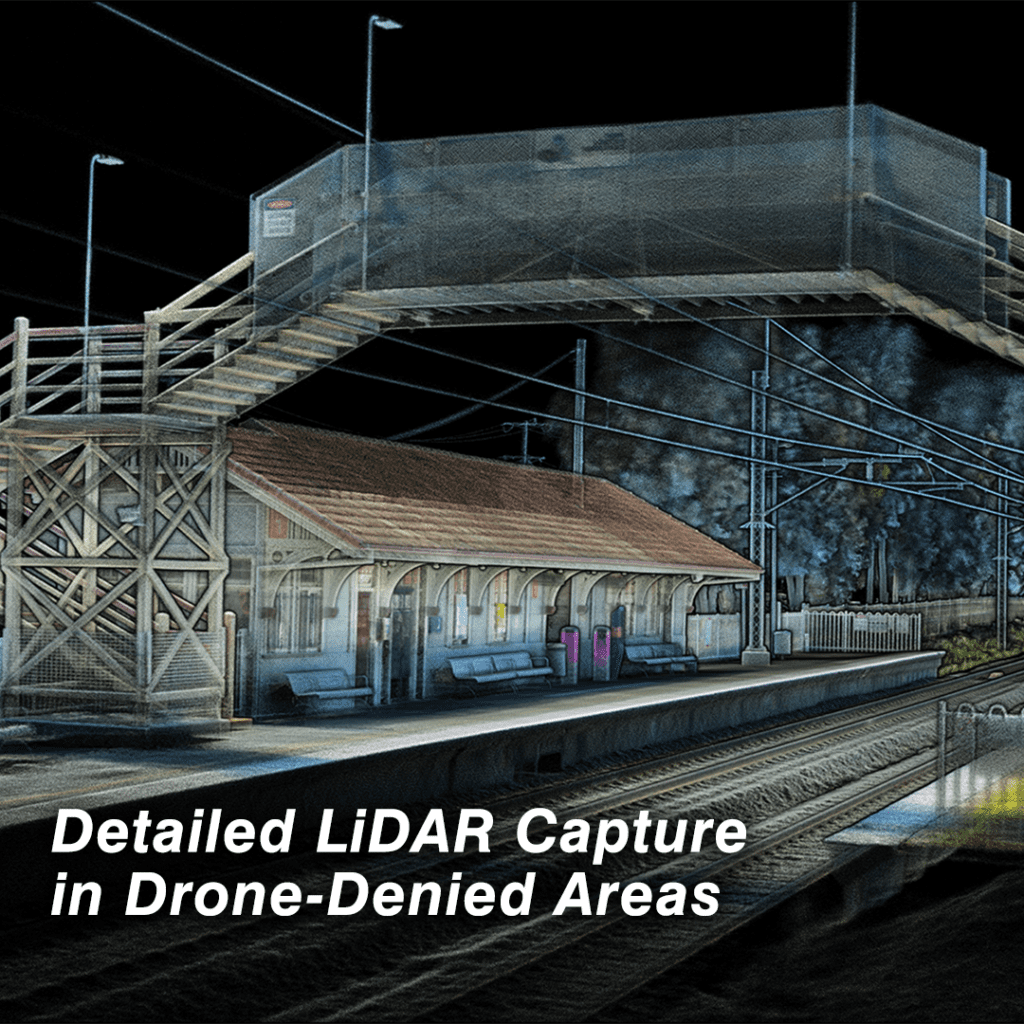
Surveyors are typically wary of using SLAM systems in challenging spaces for fear of the lack of repeatability in quantifying error and capturing inaccurate data within the pointclouds. Much like a camera in low light conditions, SLAM requires geometric features and structure in order to accurately localise and capture the surrounding environment. Without the use of external control, we put the TerrusM to the test in a challenging subterranean tunnel to test its odometric repeatability.
The experiment
This problem of quantifying pointcloud error is not unique to SLAM systems. Since SLAM maps natively observe in a relative frame, a common technique to observe map error is to repeatedly map a space and to compare each iterative map to the next in order to characterise the error within each map. Different trajectories through each map can be taken in order to remove constraints pertaining to ‘situational biases’ and so a true indication of the odometric certainty can be visually quantified. We have taken our TerrusM to a challenging flat concrete skinned tunnel to perform this experiment and put the TerrusM to the test.
Experimental constraints
The solution to maximising repeatability using SLAM technology to use any surrounding areas with significant structure to constrain areas of low geometry. For this example it meant that the scan operator shall traverse above or around the desired tunnel to effectively constrain each end of the tunnel before capturing the tunnel itself.
The method will be to start the survey 2-3m back from the entry of the subterranean area and then to approach the tunnel’s entrance. Thanks to the TerrusM’s 100m ranged LiDAR sensor, the inbuilt odometry engine is able to accurately map out a large section of the underground area from the portal. This creates a reliable “Base” for the rest of the map to constrain against. The operator will then take a path to reach the opposite tunnel entry point. Approaching the alternate portal the system will then enter the tunnel, traversing through it until they reach the other end. Once the operator has reached the other end, the operator can then exit the tunnel and complete the scan
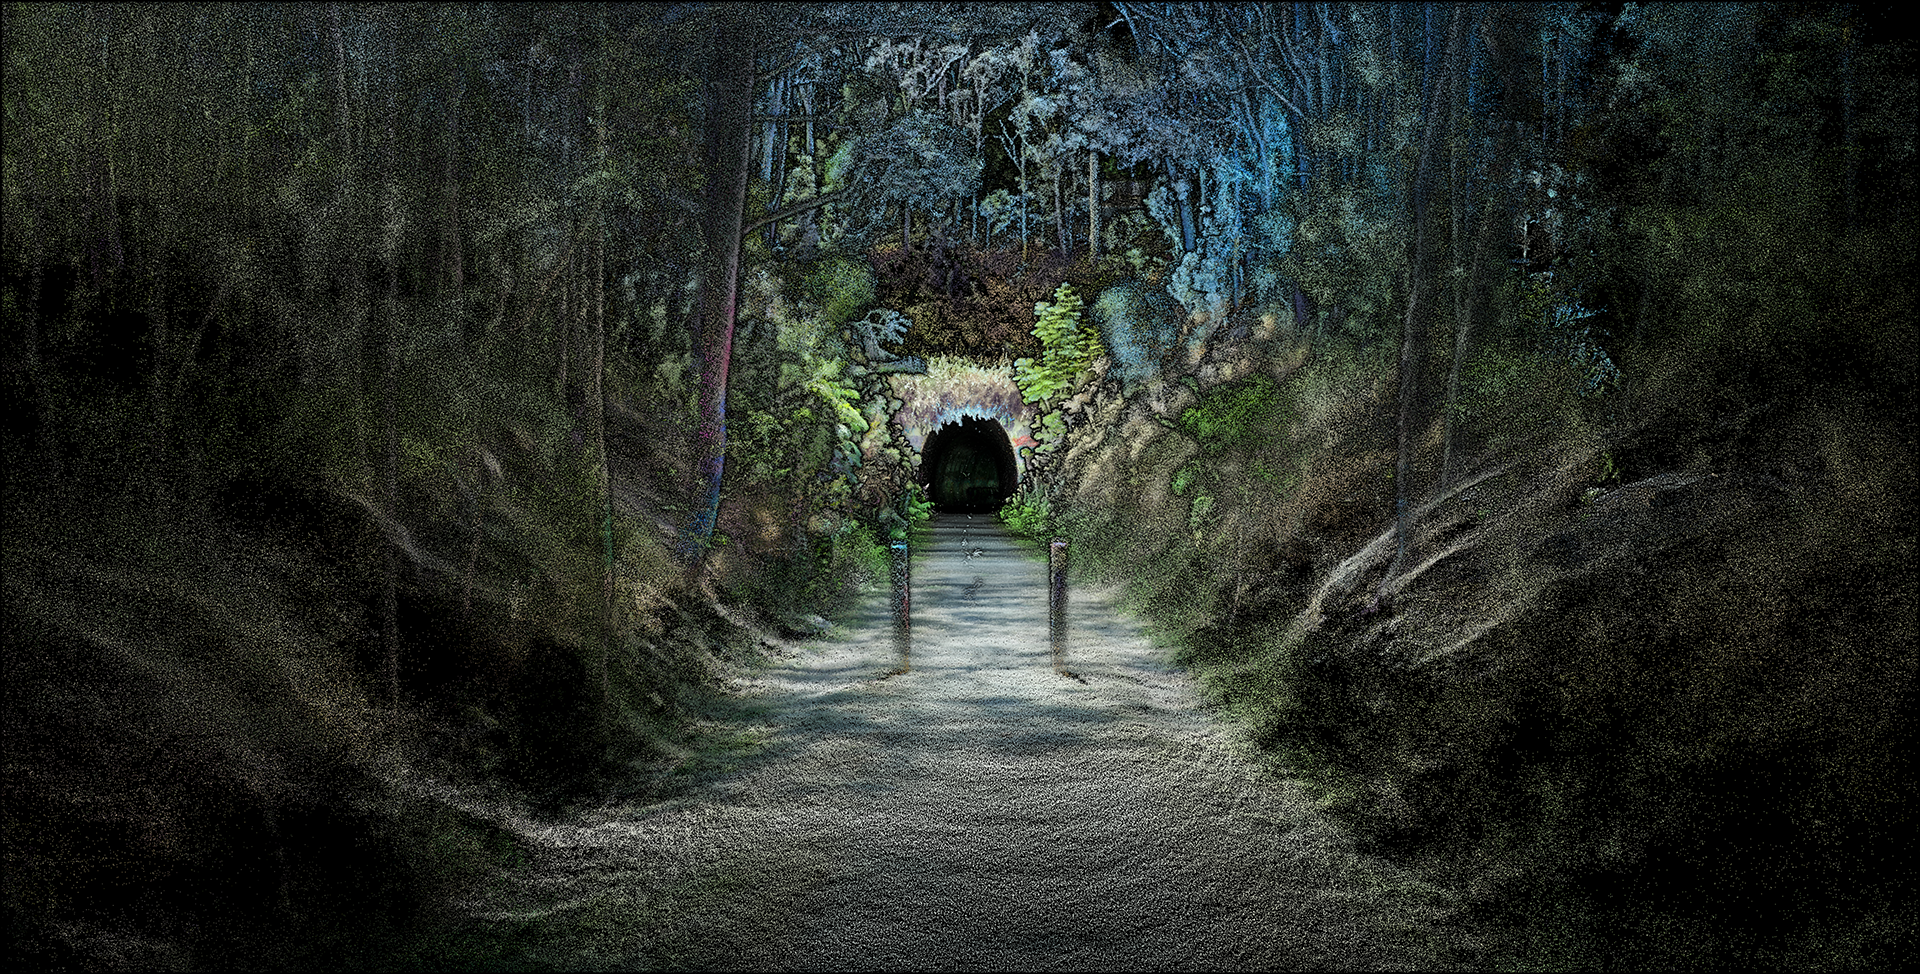
Capturing the Ernest Junction Railway
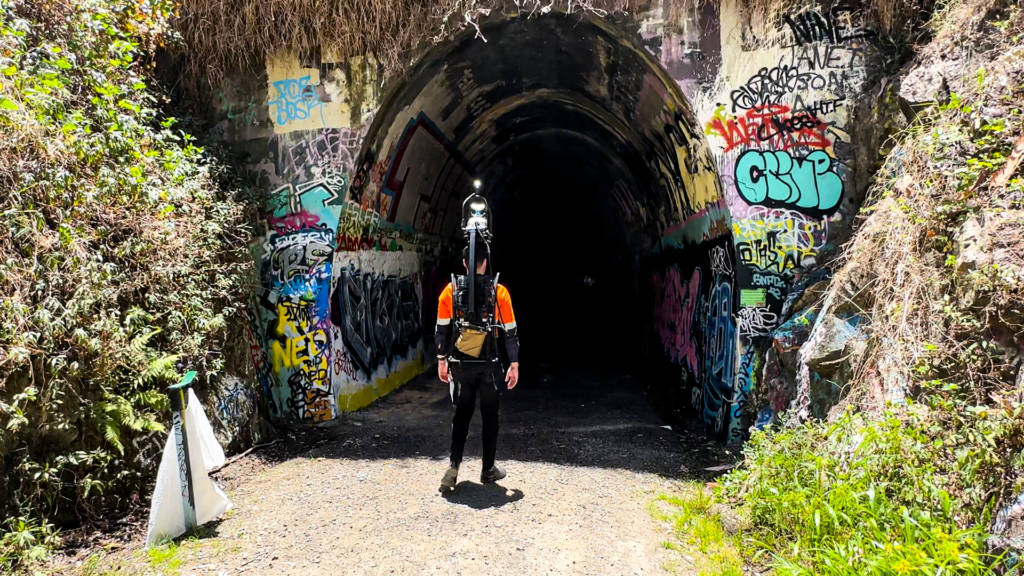
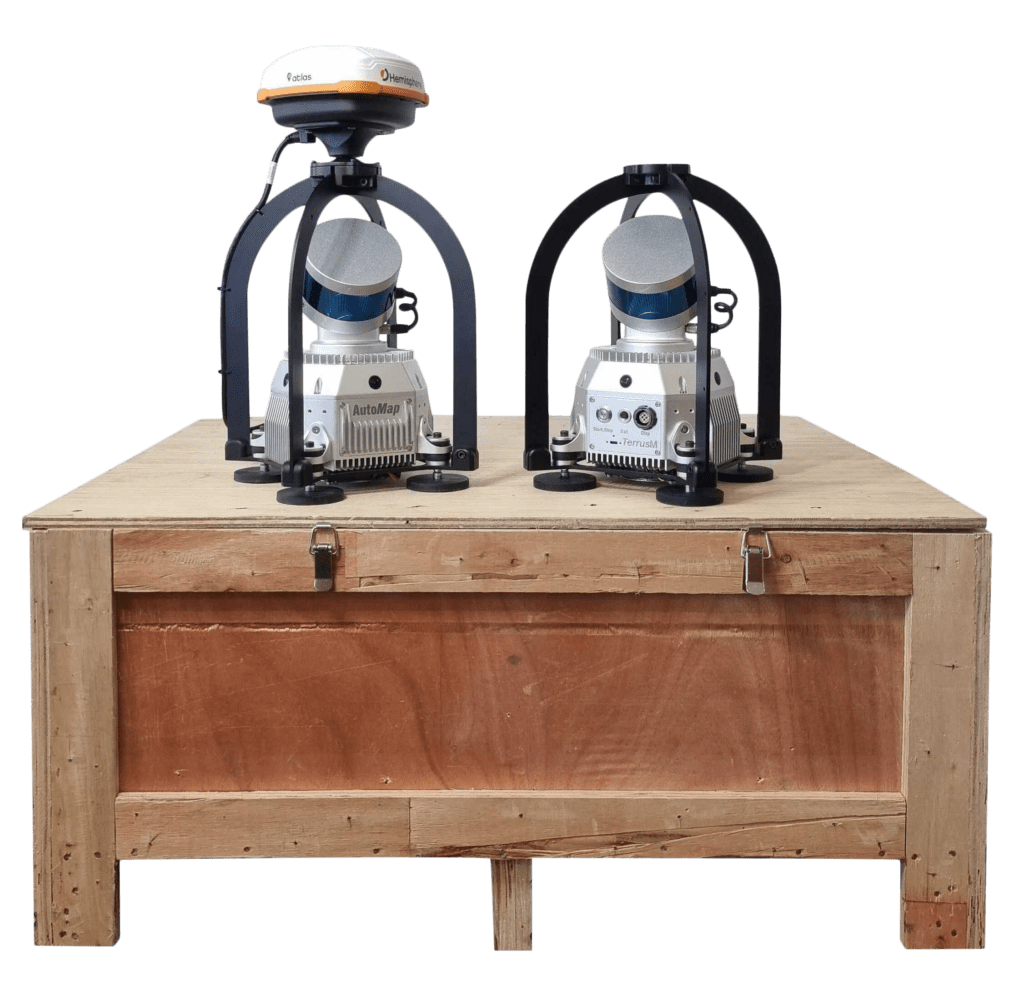
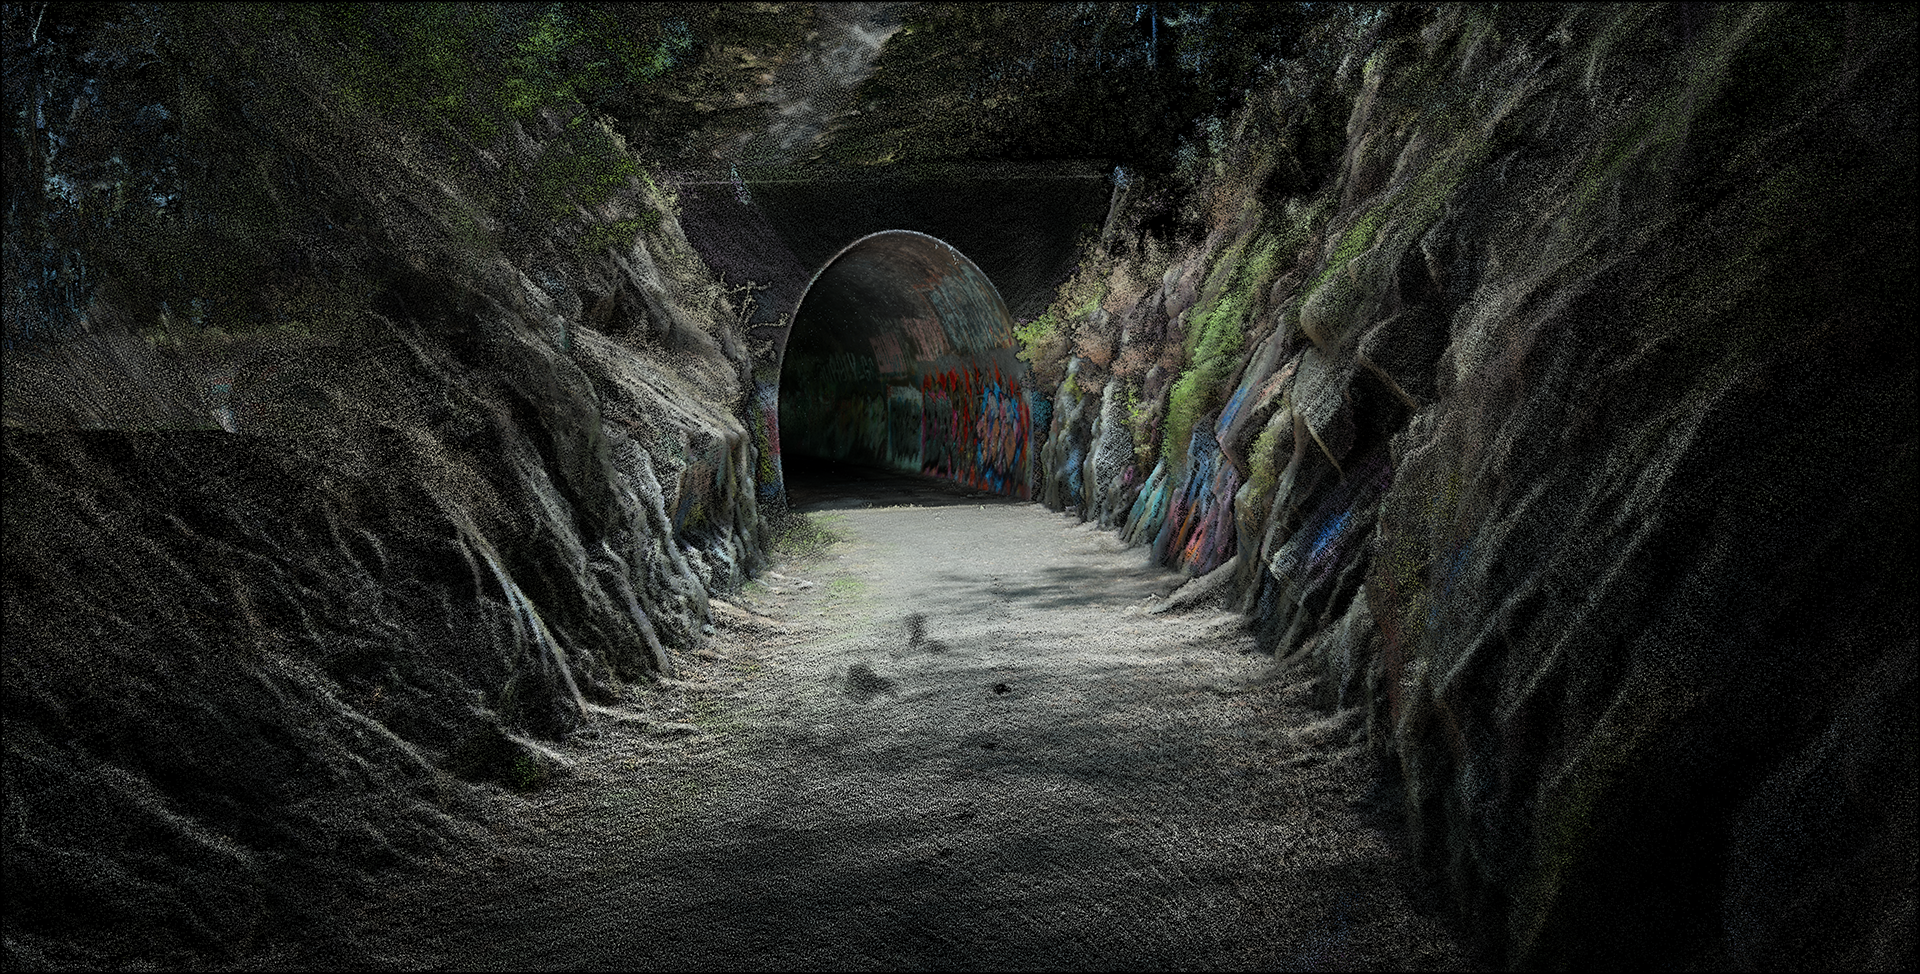
To test this method, the AutoMap team traversed down to the now abandoned Ernest Junction Railway on the Gold Coast. Aiming to capture a 200m long scan of the old rail way, the system operator employed the TerrusM with a backpack and lighting kit. These accessories were attached to allow the user to have their hands free, while lighting up the tunnel to provide light for a colourised scan.
Starting the system at the south entrance, the team into the tunnel before exiting and following the hiking trail up towards the opposite entryway. Once at the peak, the operator descended down the hill through the bush promptly making their way through the north end of the tunnel. The operator then traversed the tunnel by walking to connect back to the initial starting position.
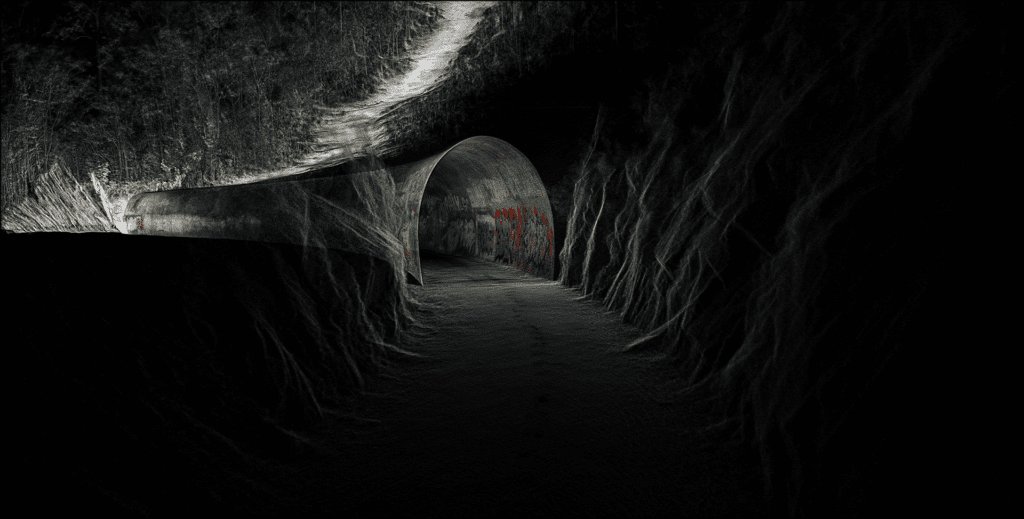
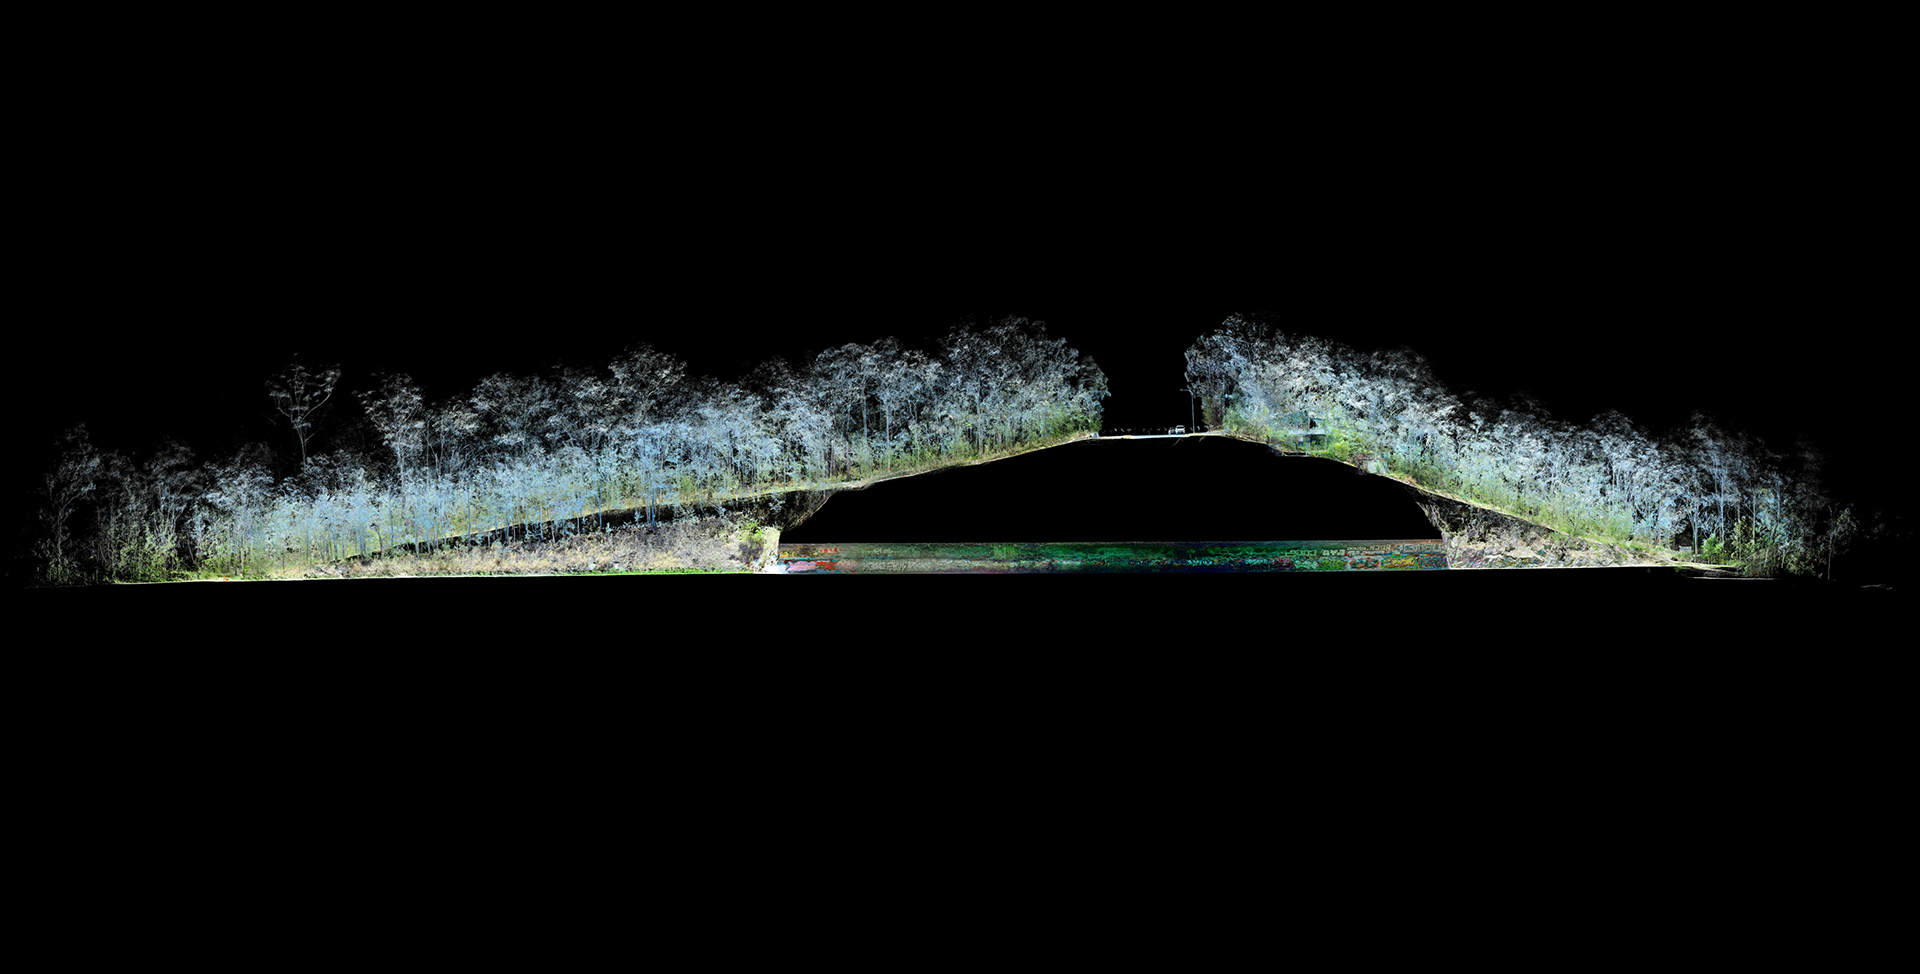
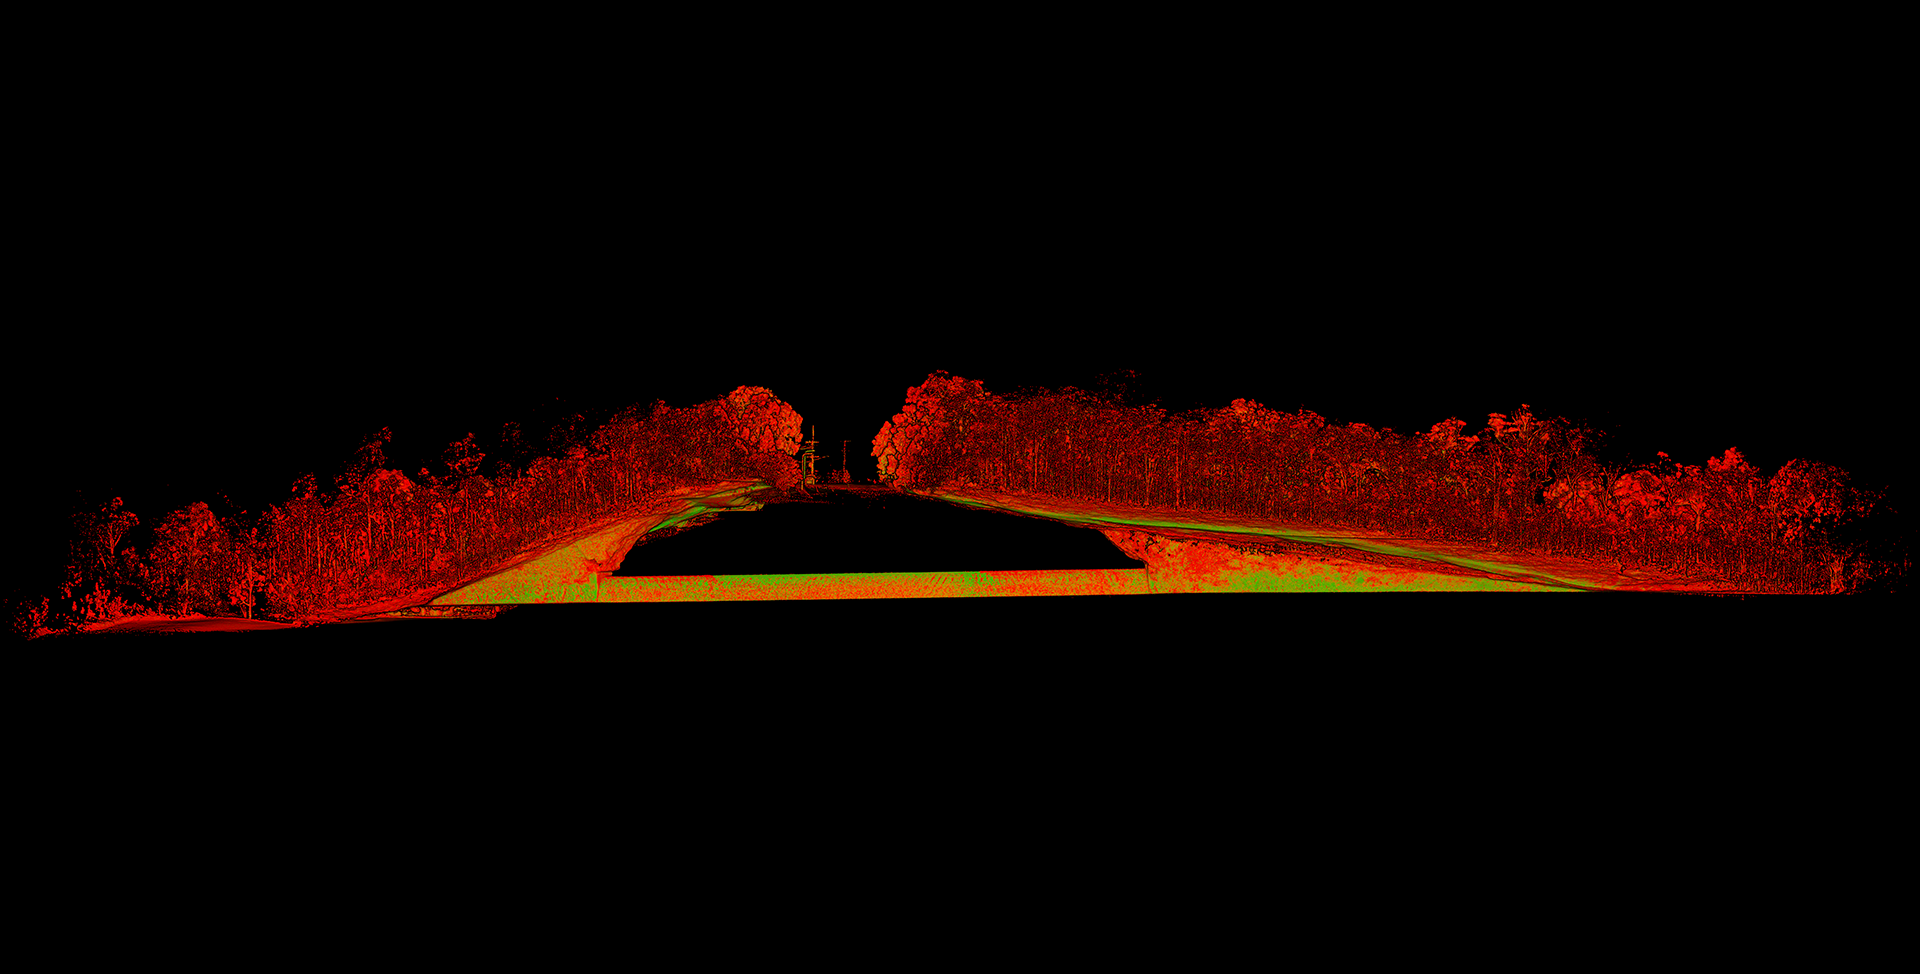
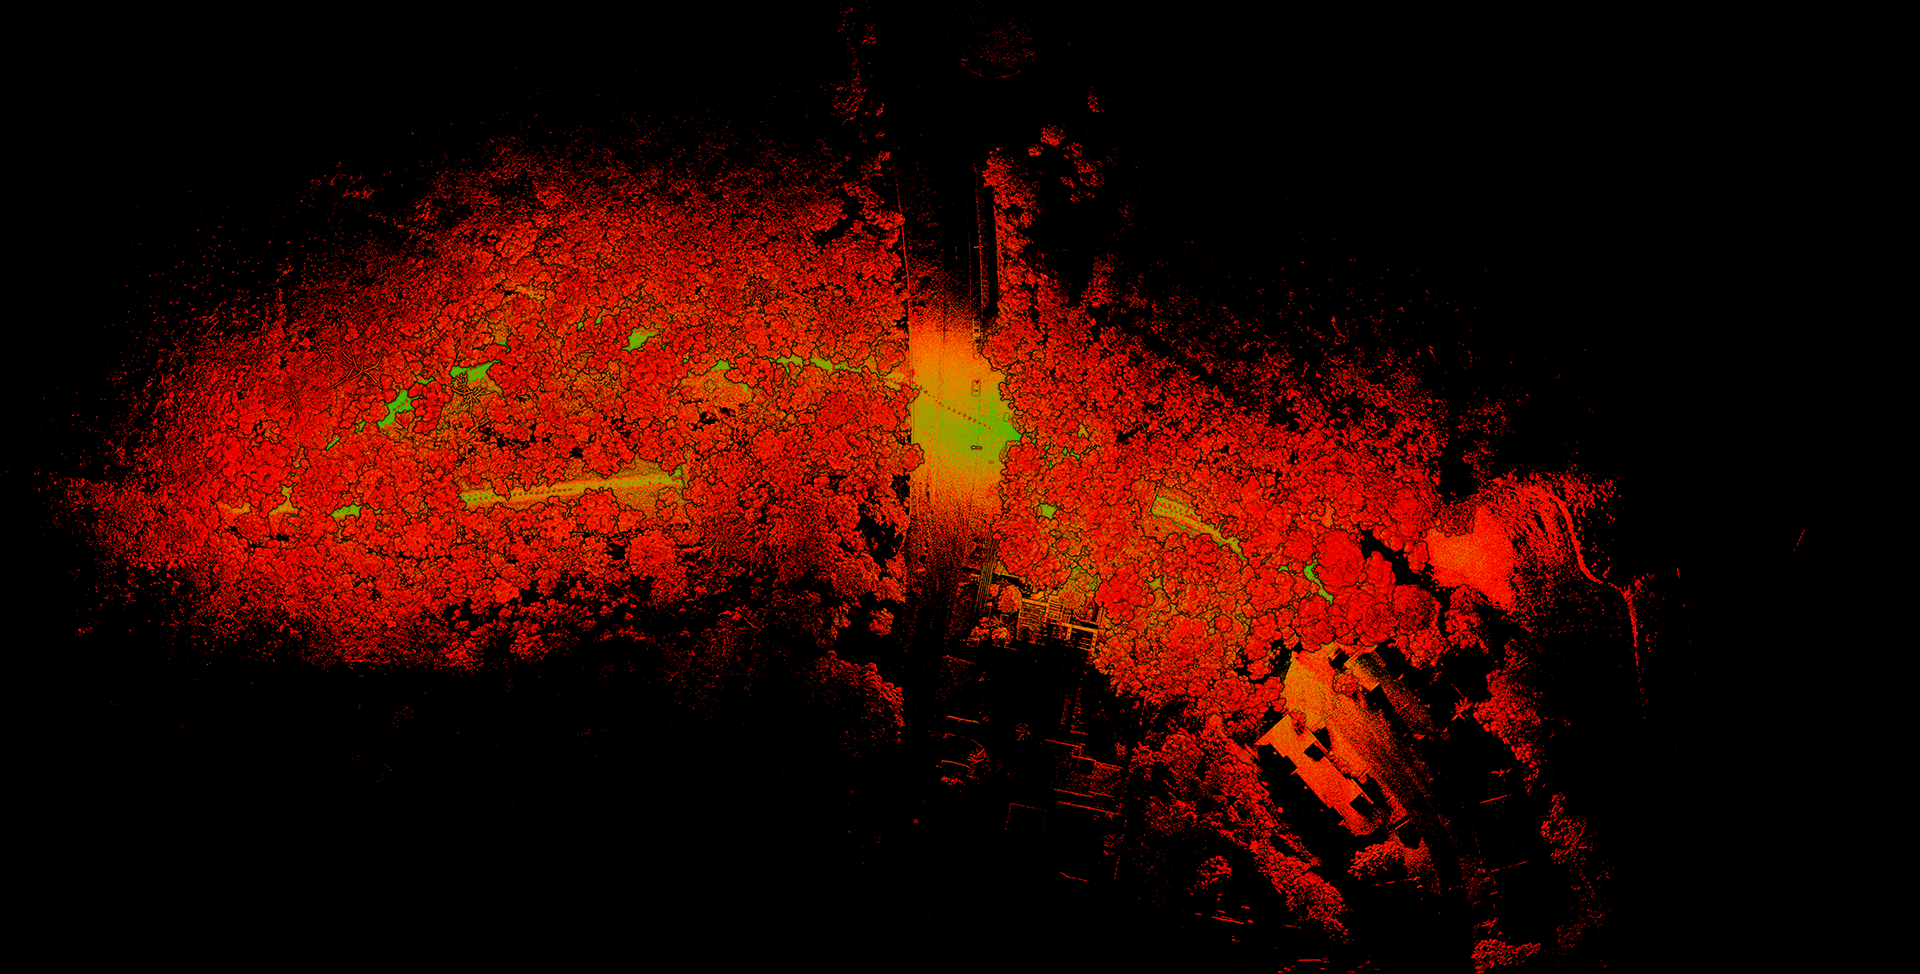
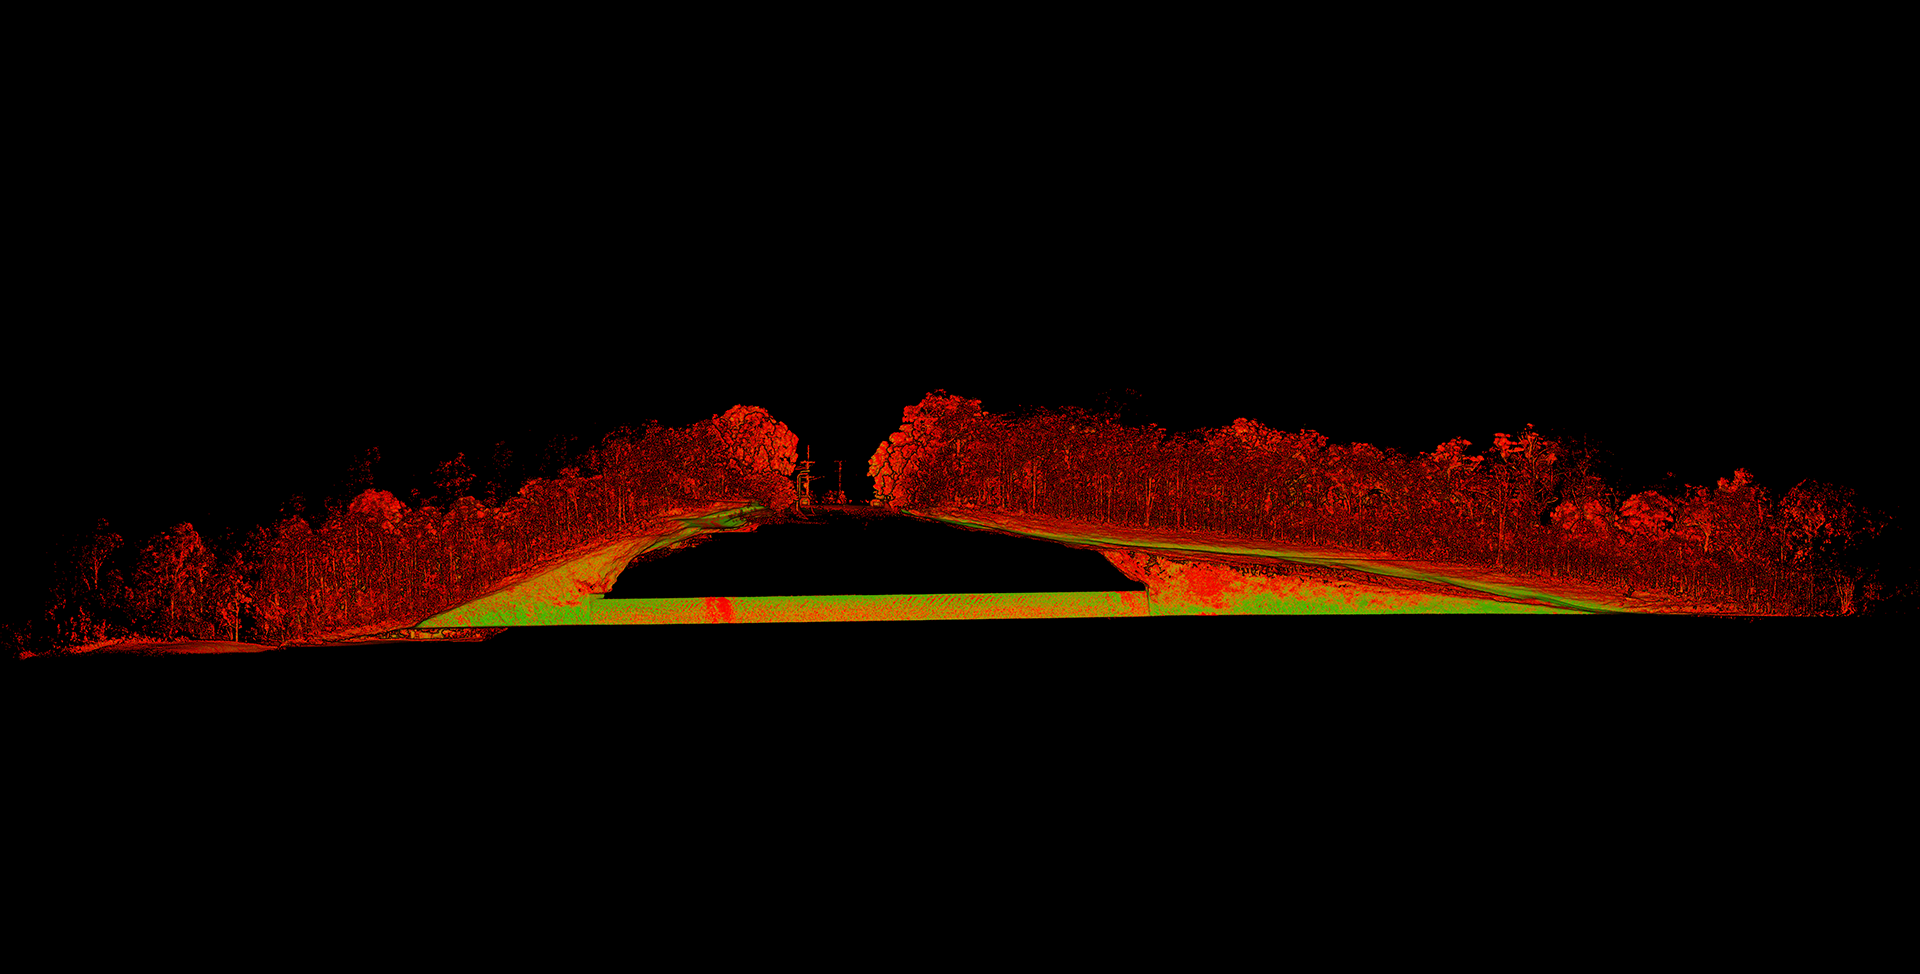
This process was repeated in the exact same manner four times to create a set of scans that could be used for odometric comparison. Each of the scans is shown below. Each image consists of two unique pointcouds which have been shaded from green (low error) to red, (high error).
The scans were then imported into a popular pointcloud package and each set of clouds were then registered together. A cloud-to-cloud comparison of each scan was then plotted in order to quantify the cloud to cloud error for each set of pointclouds.
Two sets of two scans (one in red, the other in green) that have been captured by the TerrusM and registered for comparison.
Comparitive Analysis
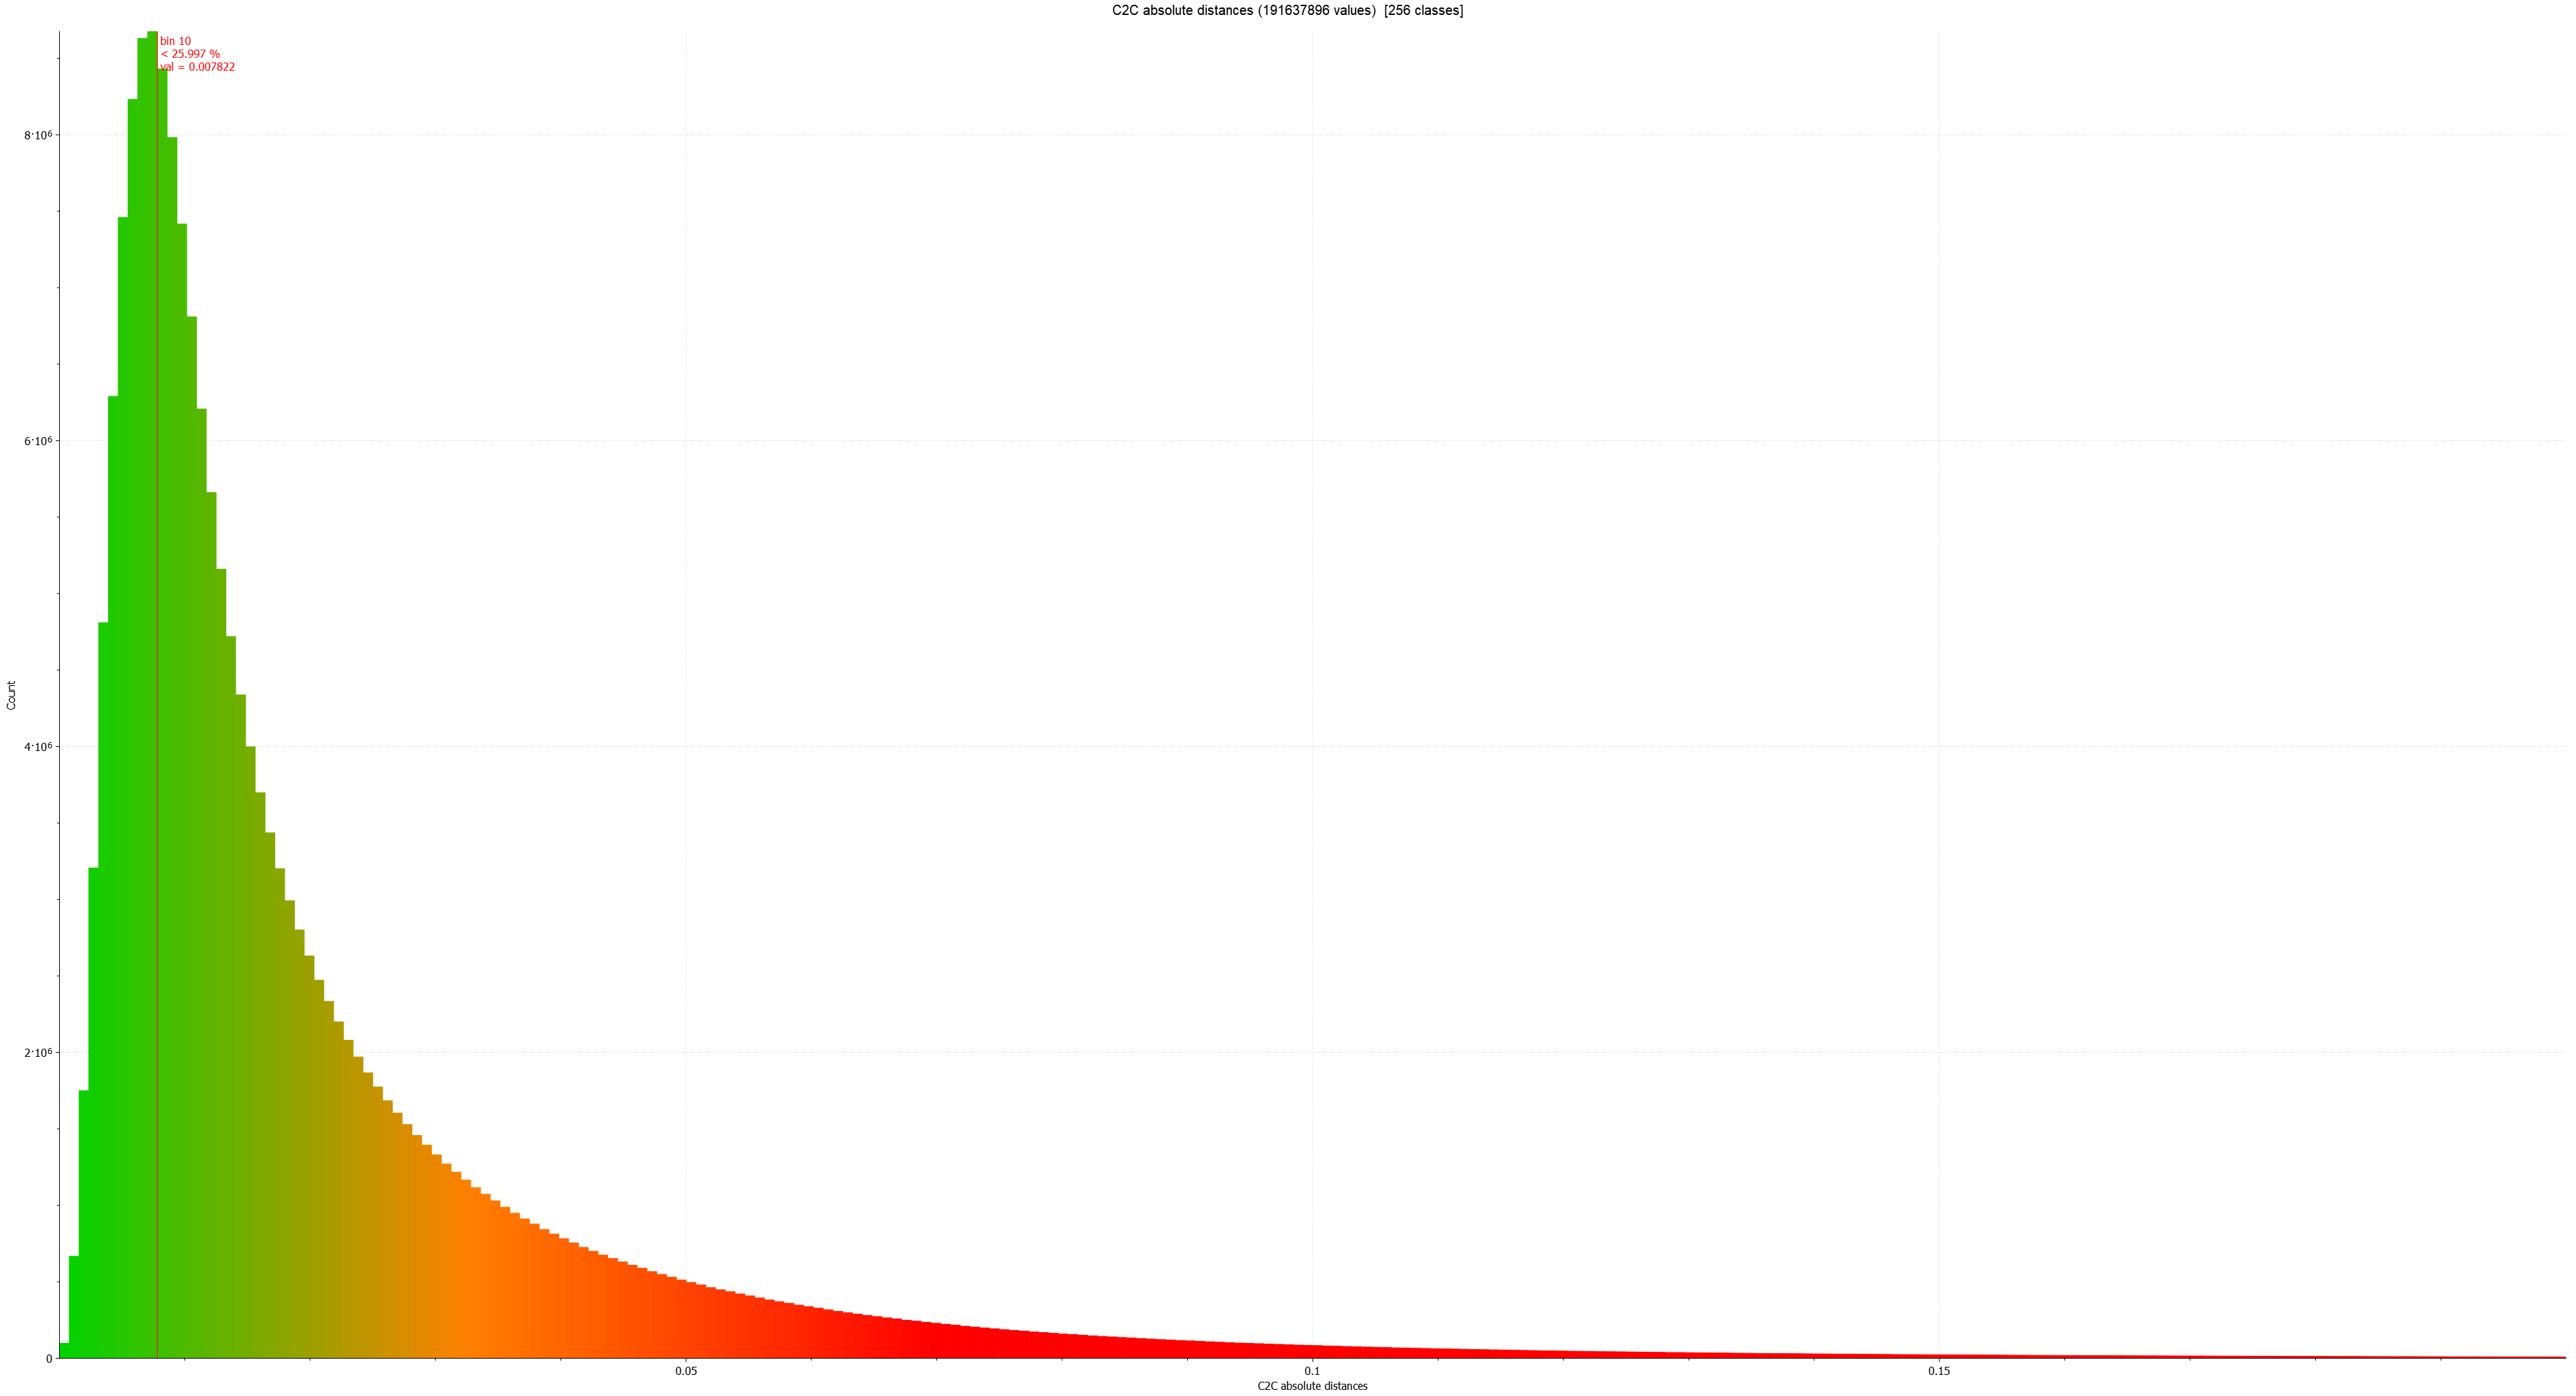
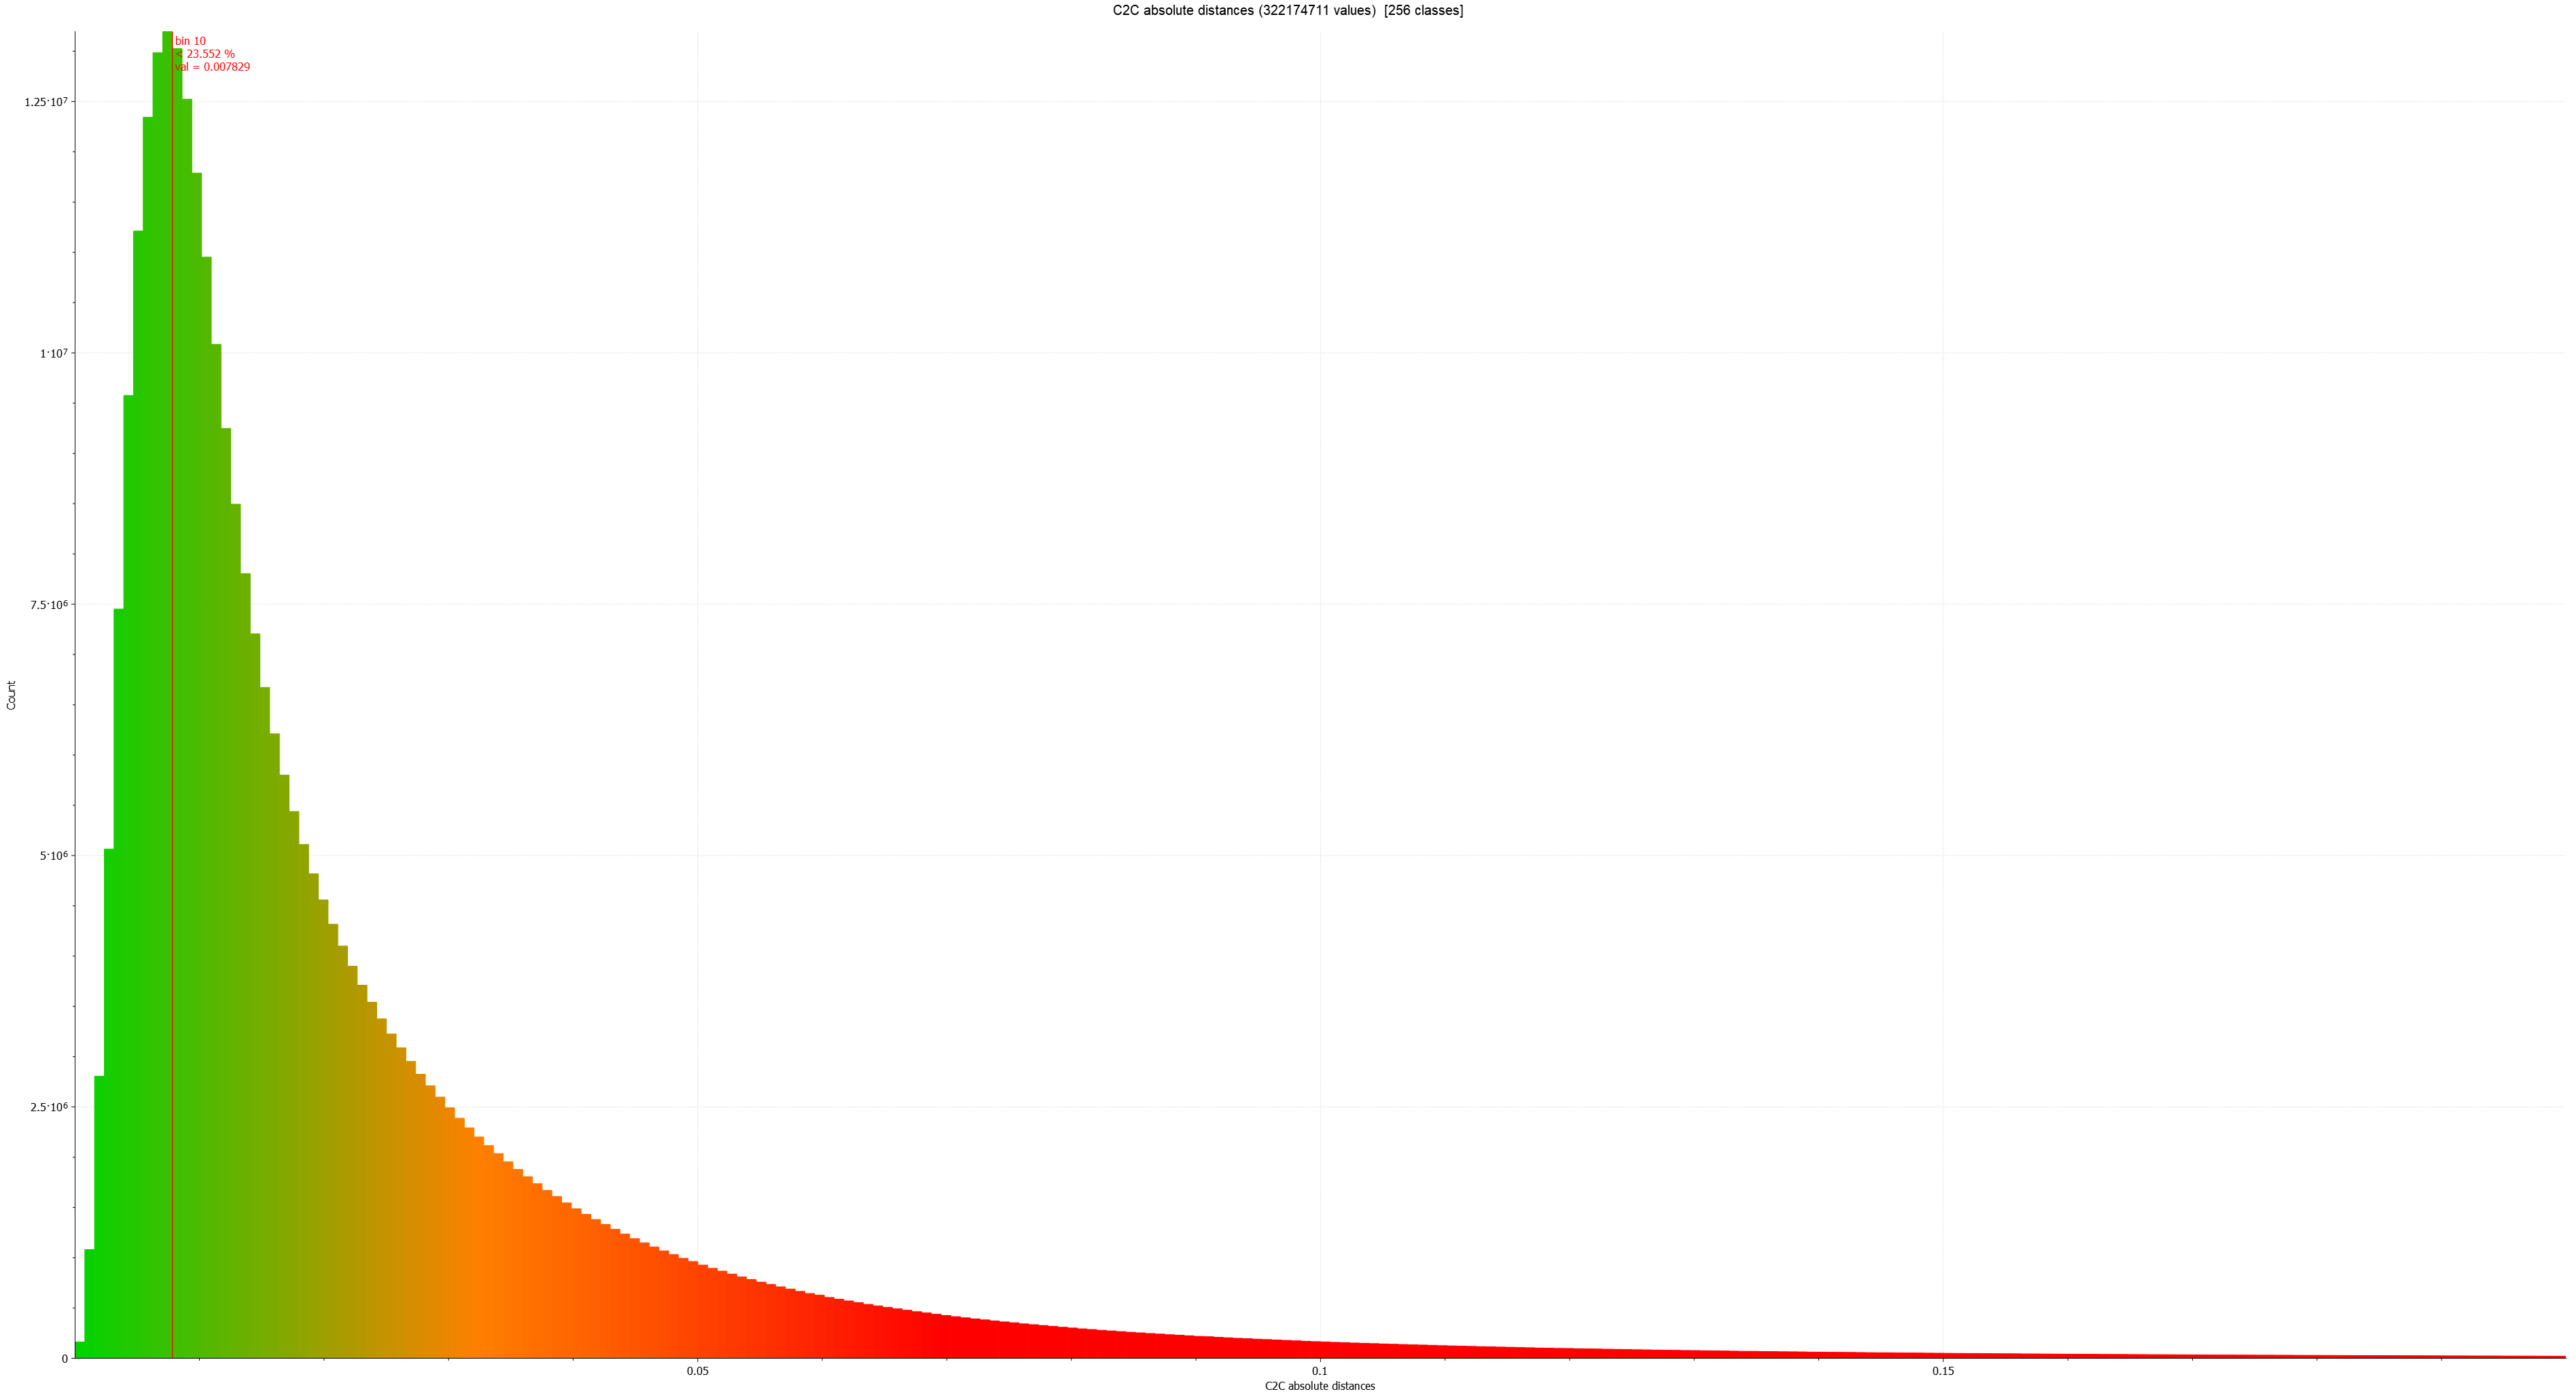
In order to compare a common baseline against the two sets of scans, a cloud-to-cloud error plot was generated and the error was plot as a distribution of number of points vs cloud-to-cloud error in metres.
Breaking down these graphs, all four maps had 25% of all captured points come in with a differential error of less than 0.007m (7mm). 50% of all collected points were under 2.5cm of difference repeatedly across the two map sessions. The graphs to the right display an error plot of the distributed differential error for each of the two scan sessions.
When conducting the experiment, it was found that data of a higher accuracy, “GREEN” in the error plot typically related to data captured of static features that were concentrated closer to the laser.
Trees and other moving features were found to have the largest amount of differential error. The maximum difference across all scans resulted in only a few points having 0.20m difference. This is represented by the “RED” colouring, a large portion of this difference is noted as a result of the moving objects in the area such as trees and road traffic. This can also be seen visually in the red shading of the maps above.
Conclusion
The results have demonstrated that it is possible to capture challenging environments like this one repeatedly to better than 0.025m on average. In areas of interest where the operator can access the space, it is possible to concentrate the laser on focused objects to obtain a decreased error of 7mm in the cloud. This outlines an ideal method for capturing complex subterranean environments such as mines or underground train stations using the TerrusM without the requirement to use survey control to conform the map.
